
Key facts
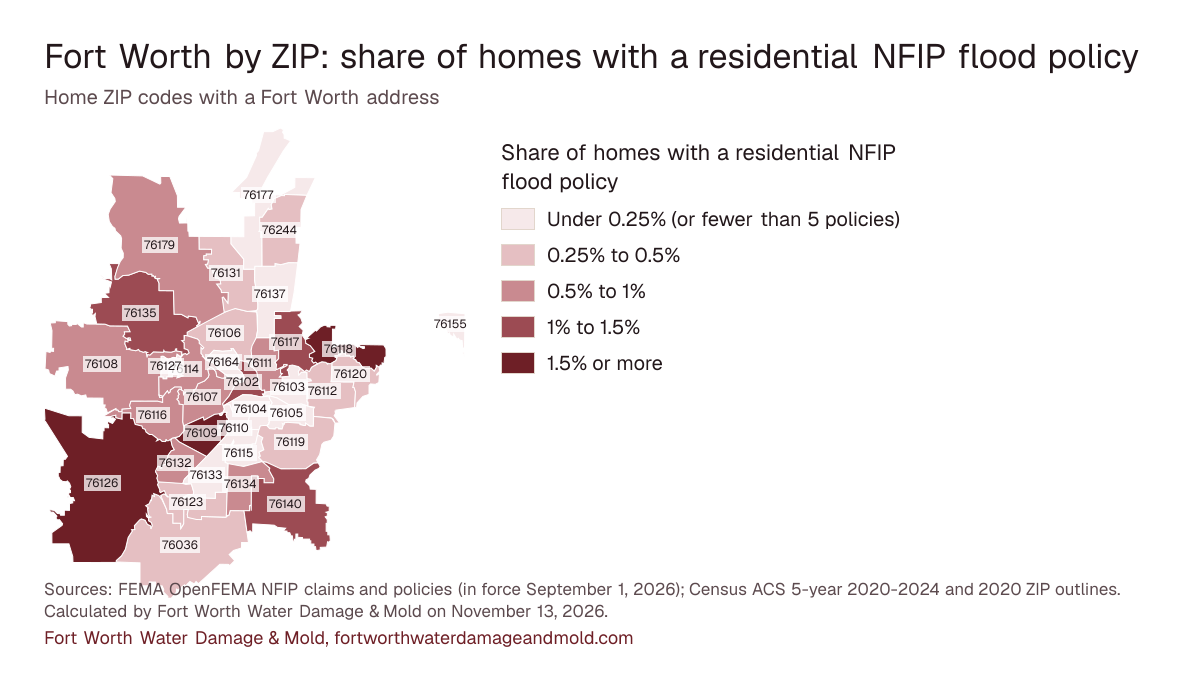
- About 0.6% of homes in the 34 Fort Worth ZIP codes on this map had a residential NFIP flood policy in force on September 1, 2026: 2,478 policies for about 438,144 homes (calculated by Fort Worth Water Damage & Mold on November 13, 2026). FEMA OpenFEMA NFIP Redacted Policies and Claims v3
- ZIP 76126 has the highest share of homes with an NFIP flood policy, 2.08%, as of September 1, 2026 (calculated by Fort Worth Water Damage & Mold on November 13, 2026). FEMA OpenFEMA NFIP Redacted Policies and Claims v3
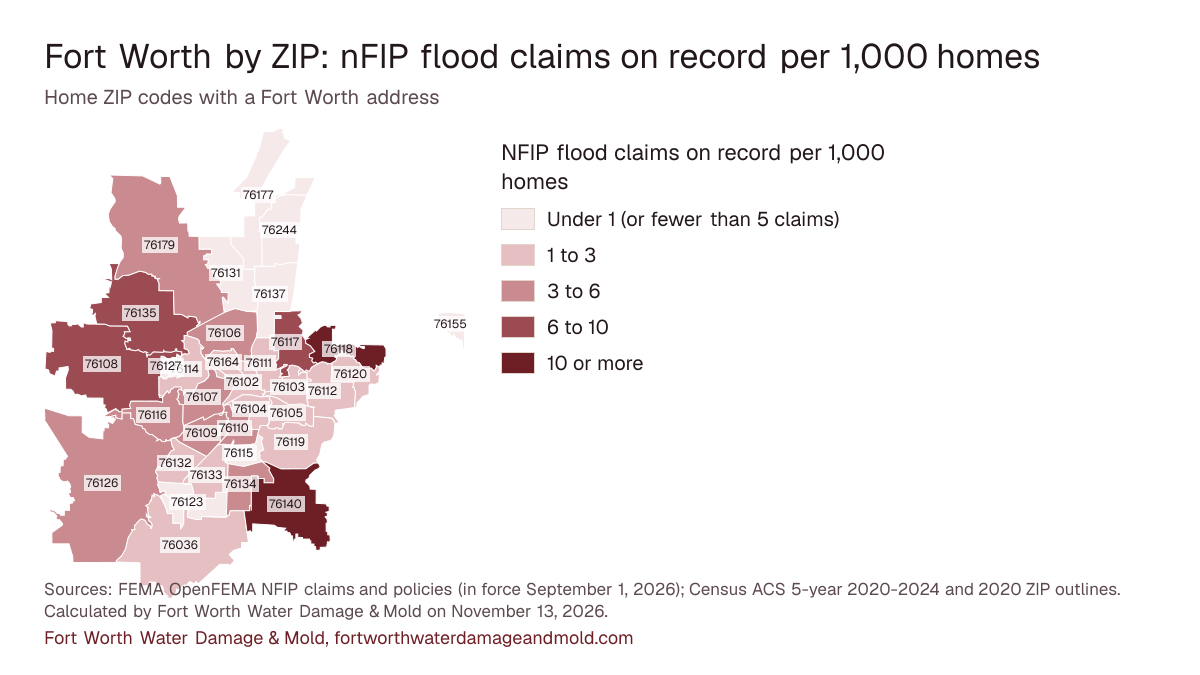
- FEMA records 1,382 NFIP flood claims in these ZIPs, with $19,993,914 paid on buildings and contents; ZIP 76140 has the most, 140 (calculated by Fort Worth Water Damage & Mold on November 13, 2026). FEMA OpenFEMA NFIP Redacted Policies and Claims v3
- Measured against its number of homes, ZIP 76118 has the most claims on record, about 18.5 per 1,000 homes (calculated by Fort Worth Water Damage & Mold on November 13, 2026). FEMA OpenFEMA NFIP Redacted Policies and Claims v3
- Fort Worth's Class 7 rating in FEMA's Community Rating System lowers NFIP premiums 15 percent for every resident, inside or outside the floodplain. FEMA: Community Rating System eligible communities, effective Oct. 1, 2026
The map
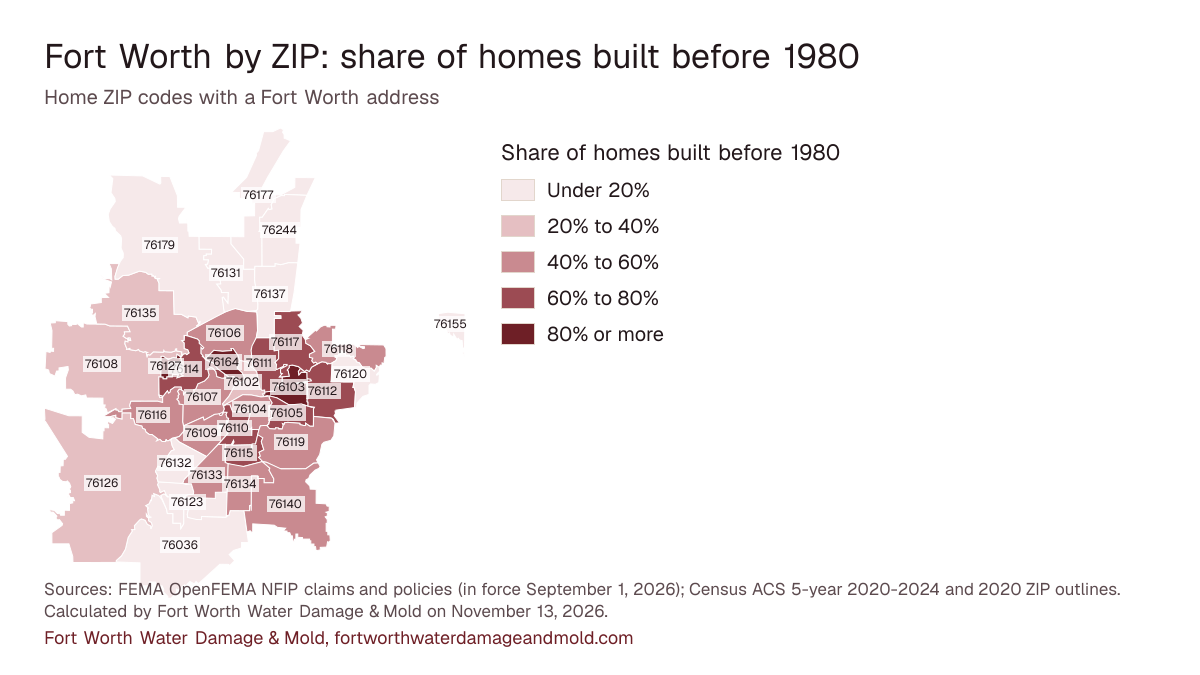
Flood policies per home run from 0.06% in ZIP 76104 to 2.08% in ZIP 76126, among ZIPs with at least 5 policies. The buttons switch the shading; the table under the map holds every number.
Share of homes with a residential NFIP flood policy
- Under 0.25% (or fewer than 5 policies)
- 0.25% to 0.5%
- 0.5% to 1%
- 1% to 1.5%
- 1.5% or more
NFIP flood claims on record per 1,000 homes
- Under 1 (or fewer than 5 claims)
- 1 to 3
- 3 to 6
- 6 to 10
- 10 or more
Share of homes built before 1980
- Under 20%
- 20% to 40%
- 40% to 60%
- 60% to 80%
- 80% or more
Sources: FEMA OpenFEMA NFIP claims and policies (in force September 1, 2026); Census ACS 5-year 2020-2024 and 2020 ZIP outlines. Calculated by Fort Worth Water Damage & Mold on November 13, 2026. Download image of the map, one per measure: flood policies per home, claims per 1,000 homes, homes built before 1980.
What these numbers can and can't tell you
Claims and policies are National Flood Insurance Program records only: private flood insurance, homeowners water claims and uninsured losses are left out. Policies count residential NFIP policies in force on September 1, 2026; one policy can cover a building with several homes, and renters can hold contents-only policies, so policies per home is an approximation. ZIP codes are as reported to FEMA. Counts under 5 show as "fewer than 5" with no dollar total or share. Homes come from Census ACS 5-year 2020-2024 estimates for ZIP Code Tabulation Areas, which approximate USPS ZIPs and carry margins of error. Land shares come from the Census 2020 ZIP-to-place file.
Every ZIP, in one table
| Area | |||||||
|---|---|---|---|---|---|---|---|
| 76140 | AreaEdges of the city shared with smaller towns (40% of the land in Fort Worth) | NFIP claims140 | Total paid$2,666,076 | Flood policies in force112 | Homes with a policy1.04% | Median year built1987 | Built before 198044% |
| 76117 | AreaNeighbor cities with a Fort Worth mailing address (15% of the land in Fort Worth) | NFIP claims127 | Total paid$3,425,379 | Flood policies in force141 | Homes with a policy1.07% | Median year built1968 | Built before 198068% |
| 76108 | AreaEdges of the city shared with smaller towns (32% of the land in Fort Worth) | NFIP claims122 | Total paid$2,489,688 | Flood policies in force126 | Homes with a policy0.69% | Median year built1992 | Built before 198031% |
| 76118 | AreaEast (68% of the land in Fort Worth) | NFIP claims120 | Total paid$1,552,187 | Flood policies in force105 | Homes with a policy1.62% | Median year built1986 | Built before 198042% |
| 76116 | AreaWest and southwest (87% of the land in Fort Worth) | NFIP claims103 | Total paid$673,704 | Flood policies in force199 | Homes with a policy0.76% | Median year built1977 | Built before 198053% |
| 76107 | AreaDowntown, Near Southside and the near west side (93% of the land in Fort Worth) | NFIP claims95 | Total paid$2,013,565 | Flood policies in force178 | Homes with a policy0.98% | Median year built1979 | Built before 198051% |
| 76179 | AreaEdges of the city shared with smaller towns (39% of the land in Fort Worth) | NFIP claims85 | Total paid$1,451,217 | Flood policies in force142 | Homes with a policy0.52% | Median year built2006 | Built before 198012% |
| 76135 | AreaEdges of the city shared with smaller towns (45% of the land in Fort Worth) | NFIP claims81 | Total paid$633,088 | Flood policies in force98 | Homes with a policy1.18% | Median year built1991 | Built before 198033% |
| 76110 | AreaDowntown, Near Southside and the near west side (100% of the land in Fort Worth) | NFIP claims53 | Total paid$608,811 | Flood policies in force11 | Homes with a policy0.09% | Median year built1949 | Built before 198079% |
| 76109 | AreaWest and southwest (98% of the land in Fort Worth) | NFIP claims49 | Total paid$420,400 | Flood policies in force192 | Homes with a policy1.67% | Median year built1977 | Built before 198052% |
| 76112 | AreaEast (100% of the land in Fort Worth) | NFIP claims43 | Total paid$328,766 | Flood policies in force57 | Homes with a policy0.30% | Median year built1975 | Built before 198063% |
| 76133 | AreaWest and southwest (100% of the land in Fort Worth) | NFIP claims42 | Total paid$192,111 | Flood policies in force50 | Homes with a policy0.25% | Median year built1977 | Built before 198057% |
| 76134 | AreaSouth and southeast (85% of the land in Fort Worth) | NFIP claims40 | Total paid$240,596 | Flood policies in force58 | Homes with a policy0.54% | Median year built1982 | Built before 198046% |
| 76126 | AreaNeighbor cities with a Fort Worth mailing address (17% of the land in Fort Worth) | NFIP claims40 | Total paid$507,904 | Flood policies in force229 | Homes with a policy2.08% | Median year built1996 | Built before 198031% |
| 76106 | AreaNorth and far north (98% of the land in Fort Worth) | NFIP claims39 | Total paid$377,332 | Flood policies in force48 | Homes with a policy0.41% | Median year built1973 | Built before 198056% |
| 76119 | AreaSouth and southeast (87% of the land in Fort Worth) | NFIP claims35 | Total paid$285,773 | Flood policies in force64 | Homes with a policy0.38% | Median year built1974 | Built before 198058% |
| 76244 | AreaNorth and far north (96% of the land in Fort Worth) | NFIP claims22 | Total paid$379,774 | Flood policies in force90 | Homes with a policy0.34% | Median year built2006 | Built before 19804% |
| 76132 | AreaWest and southwest (93% of the land in Fort Worth) | NFIP claims20 | Total paid$133,963 | Flood policies in force101 | Homes with a policy0.72% | Median year built1990 | Built before 198017% |
| 76114 | AreaEdges of the city shared with smaller towns (41% of the land in Fort Worth) | NFIP claims17 | Total paid$125,850 | Flood policies in force94 | Homes with a policy0.85% | Median year built1967 | Built before 198062% |
| 76111 | AreaEast (95% of the land in Fort Worth) | NFIP claims16 | Total paid$125,944 | Flood policies in force43 | Homes with a policy0.50% | Median year built1956 | Built before 198077% |
| 76036 | AreaNeighbor cities with a Fort Worth mailing address (20% of the land in Fort Worth) | NFIP claims16 | Total paid$385,134 | Flood policies in force50 | Homes with a policy0.40% | Median year built2006 | Built before 198017% |
| 76102 | AreaDowntown, Near Southside and the near west side (100% of the land in Fort Worth) | NFIP claims12 | Total paid$96,615 | Flood policies in force66 | Homes with a policy1.11% | Median year built2006 | Built before 198024% |
| 76137 | AreaNorth and far north (82% of the land in Fort Worth) | NFIP claims10 | Total paid$51,962 | Flood policies in force43 | Homes with a policy0.17% | Median year built1997 | Built before 19805% |
| 76104 | AreaDowntown, Near Southside and the near west side (100% of the land in Fort Worth) | NFIP claims10 | Total paid$243,314 | Flood policies in force6 | Homes with a policy0.06% | Median year built1989 | Built before 198047% |
| 76120 | AreaEast (99% of the land in Fort Worth) | NFIP claims9 | Total paid$15,946 | Flood policies in force38 | Homes with a policy0.43% | Median year built2000 | Built before 19809% |
| 76131 | AreaNorth and far north (69% of the land in Fort Worth) | NFIP claims8 | Total paid$188,959 | Flood policies in force53 | Homes with a policy0.28% | Median year built2009 | Built before 19804% |
| 76105 | AreaSouth and southeast (100% of the land in Fort Worth) | NFIP claims8 | Total paid$72,598 | Flood policies in force13 | Homes with a policy0.17% | Median year built1959 | Built before 198075% |
| 76103 | AreaEast (100% of the land in Fort Worth) | NFIP claims8 | Total paid$138,190 | Flood policies in force7 | Homes with a policy0.12% | Median year built1956 | Built before 198085% |
| 76164 | AreaNorth and far north (100% of the land in Fort Worth) | NFIP claims7 | Total paid$128,522 | Flood policies in forcefewer than 5 | Homes with a policyNot shown | Median year built1942 | Built before 198083% |
| 76115 | AreaSouth and southeast (100% of the land in Fort Worth) | NFIP claimsfewer than 5 | Total paidNot shown | Flood policies in force5 | Homes with a policy0.08% | Median year built1965 | Built before 198068% |
| 76123 | AreaSouth and southeast (92% of the land in Fort Worth) | NFIP claimsfewer than 5 | Total paidNot shown | Flood policies in force42 | Homes with a policy0.29% | Median year built2006 | Built before 19803% |
| 76177 | AreaNorth and far north (83% of the land in Fort Worth) | NFIP claimsfewer than 5 | Total paidNot shown | Flood policies in force15 | Homes with a policy0.14% | Median year built2013 | Built before 19804% |
| 76155 | AreaEast (100% of the land in Fort Worth) | NFIP claimsfewer than 5 | Total paidNot shown | Flood policies in forcefewer than 5 | Homes with a policyNot shown | Median year built2001 | Built before 19801% |
| 76127 | AreaWest and southwest (98% of the land in Fort Worth) | NFIP claimsfewer than 5 | Total paidNot shown | Flood policies in forcefewer than 5 | Homes with a policyNot shown | Median year builtNo estimate | Built before 1980100% |
Source: FEMA OpenFEMA NFIP Redacted Claims v3 and NFIP Redacted Policies v3; U.S. Census Bureau ACS 5-year 2020-2024, tables B25034 and B25035; calculated by Fort Worth Water Damage & Mold on November 13, 2026. See sources and methods. This product uses the Federal Emergency Management Agency's OpenFEMA API, but is not endorsed by FEMA. The Federal Government or FEMA cannot vouch for the data or analyses derived from these data after the data have been retrieved from the Agency's website(s).
For the flood zone of one address, the City of Fort Worth's Flood Risk Viewer shows FEMA floodplains and the city's own flood risk areas, and OneAddress looks up a single property; FEMA's Flood Map Service Center has the official maps. The storms behind the busiest claim years are on the Fort Worth flooding record, and cleanup after outside water is covered on the flood damage restoration page.
Cite this page: “Fort Worth Flood Map by ZIP: Claims and Policies.” Fort Worth Water Damage & Mold, https://fortworthwaterdamageandmold.com/fort-worth-flood-map/. Updated November 13, 2026.